Looking for ways to analyze stocks? Stock market investors and analysts look at a number of factors to predict prices of the stock whether they will go up or down. In other words, they try to indicate the probable stock price movement direction.
Why you should become your own stock analyst? The answer is pretty simple if you are an investor who wants to become self-reliant (not depending on any other person or have doubts about analysts’ credibility), then you should become your own stock analysts.


The first step is to develop a probing mind in the stock analyst process. You need to start your journey by figuring out what to buy or sell at what price. For that, you need to start with one particular industry or sector only. Within that selected sector, you need to pay focus on selected companies. Then the next step is to deeply probe the company affairs which can be done by picking out common variables from the financial statements of the company.
Common Variable to Analyse Stock
Some of the most common variables used for the analysis of stock price movement direction are Market Cap, EPS, and Financial Ratios.
-
Market Cap


The market cap or stock market capitalization is the total value of all outstanding shares of a publicly-traded company. Higher capitalization generally is an indication of a company’s financial soundness and establishment.
Exchange regulatory bodies require regularly earning reports from publicly traded companies. Then these reports are carefully checked by the market analysts as they provide an indication of the performance of the company’s overall performance. These reports need to issued quarterly and annually by publicly traded firms.
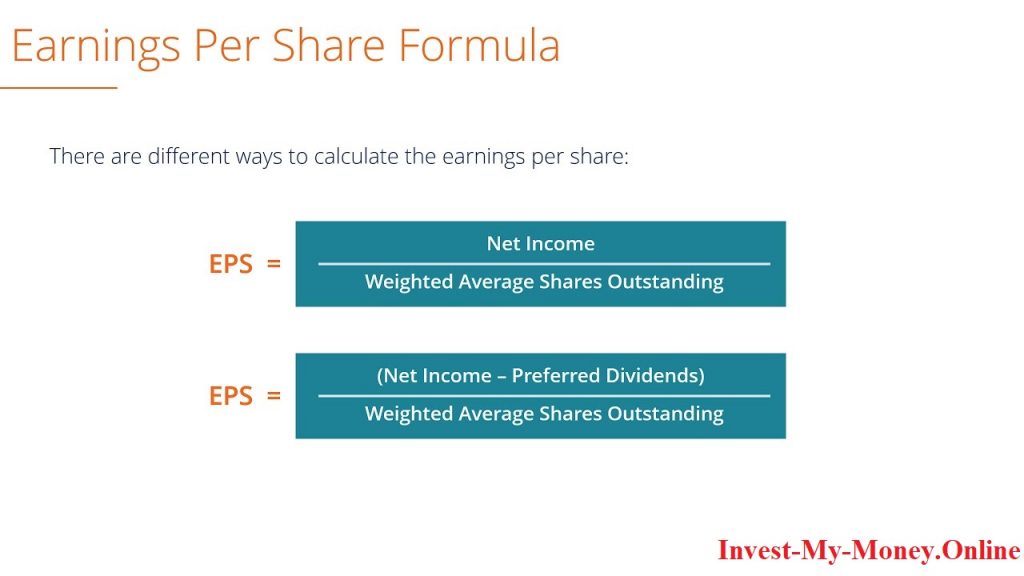
Out of the many variables, estimating the value from earning reports is the Company’s EPS (Earning per share), which reflects the company’s overall profit divided among all outstanding shares.
-
Financial Ratios

Financial investors and analysts tend to analyze a number of financial ratios to estimate a firm’s stability, growth, and profitability. Some key financial ratios consider by investors and analysts are :
- P/E Ratio
- Debt-Equity Ratio
- ROE Ratio
- Profit Margin
Let’s understand what each ratio states about the performance of an organization.
- Price to Earnings Ratio: P/E ratio is the ratio of the stock price of a company in relation to its EPS. A Higher P/E ratio is the indication of investors willing to pay a higher price per share because they expect the company to grow and the price of the stock to go high.
- Debt to Equity Ratio: This is a basic metric showing company’s financial stability. It states the total percentage of the company’s operation funded by debt in comparison to total operations funded by investors. The lower debt-equity ratio is highly preferable as it states primarily funding is done by investors only.
- Return On Equity Ratio: ROE ratio indicates a company’s good growth, as it shows the return to investors on the net income. The higher the ratio the better the profits.
- Profit Margin: There are many profit margin ratio’s considered by investors and analysts. Operating profit margin and net profit margin are two profit margin ratios examples. Looking at the company’s profit margin instead of absolute dollar profit shows the percentage of the company’s profitability. For instance, if a company shows a profit of $5 million, but it is able to translate only a 1% profit margin, then any decline in profit may threaten the company’s profitability.
Other Commonly Used Financial Ratios:

ROA (Return on Assets), Yield to Dividend, Current Ratio, Price
to book ratio, and inventory turnover ratio are some frequently
used financial ratios by stock market analysts and investors.
Table of Contents