Do you want to learn more about using pivot points as technical indicators? There are lots of technical indicators used by technical analysis while trading. Pivot points are one of those technical indicators which help in determining the overall market trend over different time frames.
The pivot technical indicator in itself is an average of intraday’s high and low and the closing price from the prior trading session.

If you are also interested in learning about the usage of Moving Averages for predictions, please refer to our last article on Technical indicator – Moving Averages. Well, Without wasting any more time let’s get back on to the topic.
How Pivot can be used as a Trading Strategy?
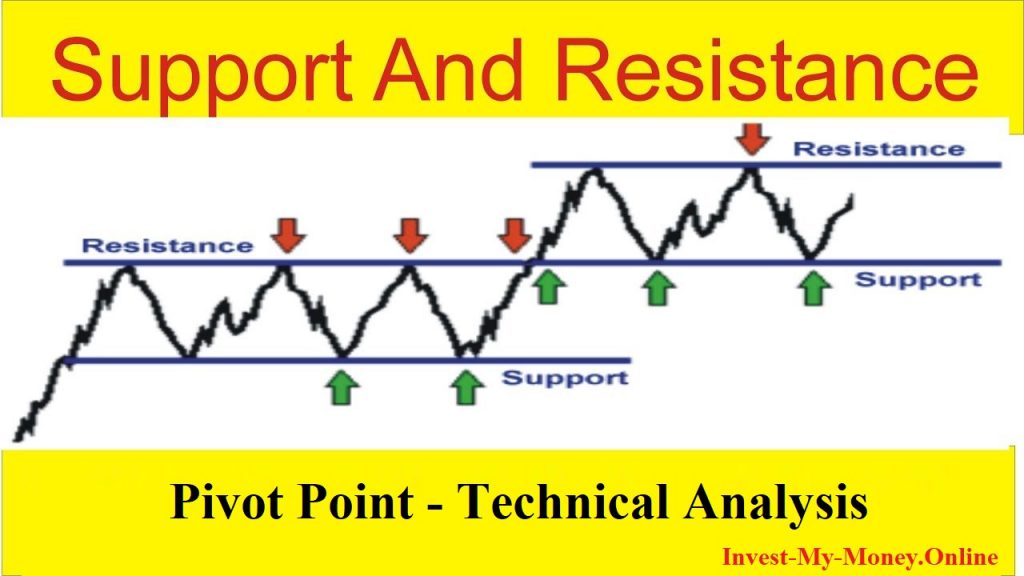
Pivot as a technical indicator helps in identifying support to many traders in predicting what should be the entering and closing level while trading. The Pivot point mostly contains a level in which trading occurs. If trading rise high through the pivot level and all associated levels, this is a condition known as “breakout” by many traders, where the securities price either shifts higher or lower hinging on the breakout direction completely.

Daily pivot points and their associated or resisted levels are calculated on the basis of the previous trading day’s high, low, opening, and closing price of a security. Want to see how this works, then you can see it by yourself as pivot point are published on each day widely and with the pivot point indicators you can directly just put it up on a chart and it will do all the calculation on its own and will reveal you the points of the level of entry-exit, identify overall market trends, highlights potential future supports and resistance levels, etc.
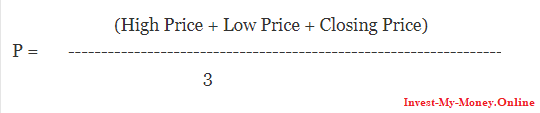
How To Calculate Pivot Points?
The formula for pivot points is :

R1 = (P x 2) – Low Price
R2 = P + (High Price – Low Price)
S1 = (P x 2) – Low Price
S2 = P – (High Price – Low Price)
where,
P = Pivot Levels
R1 = Resistance 1
R2 = Resistance 2
S1 = Support 1
S2 = Support 2
Notes:
- High Price means the highest price from the previous trading day,
- Low Price means the lowest price from the previous trading day and
- Close Price means the closing price from the previous trading day.
What Are The Limitations of Pivot Points?
The pivot is based on a very simple calculation and it might work for some while others may not find it much useful. The pivot level does not assure that the price will move up or reverse or even reach the levels on the pivot chart.
There might also be possibilities of the price of securities moving back and forth through a level. So, just like with any other technical analysis indicators, pivot points should also be used in parts for a trading strategy.
Table of Contents